I. Main Cost Ranges
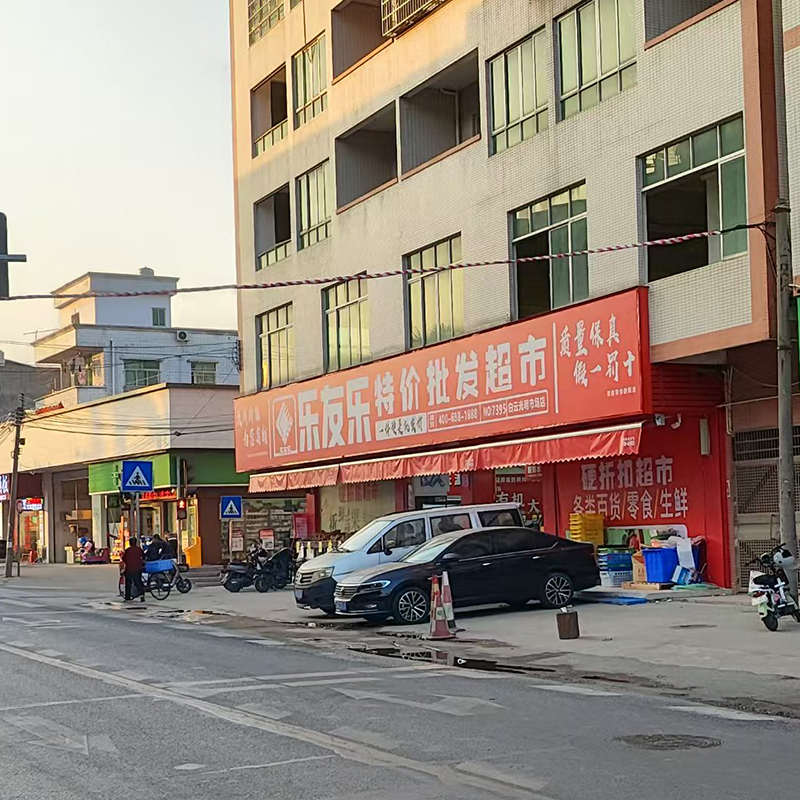
1. Small Grocery Store
Startup Cost: Approximately $60,000 to $250,000.
Typical Expenses: Small rental space ($2,000-$5,000/month), basic renovations ($20,000-$50,000), essential equipment ($15,000-$30,000), initial inventory ($30,000-$50,000).
Example: Community convenience store or specialty shop with streamlined inventory and low-rent location.
2. Medium-Sized Supermarket
Startup Cost: Approximately $250,000 to $500,000.
Typical Expenses: Rent ($5,000-$10,000/month), renovations ($50,000-$100,000), equipment ($50,000-$100,000), inventory ($75,000-$150,000).
Example: A medium-sized supermarket covering daily essentials, requiring refrigeration, shelves, and a POS system.
3. Large Chain Supermarket
Startup Cost: $500,000 to over $1,000,000.
Typical Expenses: Large location lease or purchase ($10,000-$25,000/month), high-end renovations ($100,000-$250,000), automated equipment ($100,000-$200,000), inventory ($200,000-$300,000).
Example: Requires multiple store locations, offering fresh produce, deli services, and online delivery.
II. Key Expense Items
1. Location Costs
Rent or Purchase: Accounts for 30%-50% of total costs. Prime city locations can exceed $20,000/month, while suburban or small-town spaces may be as low as $2,000/month.
Renovation & Design: $20,000-$200,000, covering shelves, lighting, refrigeration, etc.
2. Equipment & Inventory
Equipment: Refrigeration units, shelves, POS systems, etc., requiring $15,000-$300,000. Second-hand equipment can save 20%-50%.
Initial Inventory: Food and non-food items require $30,000-$300,000, with a recommended focus on high-turnover products before expanding.
3. Licenses & Compliance
Permits: Health permits, business licenses, etc., cost around $1,000-$5,000.
Insurance: Annual premiums range from $2,000-$15,000, covering liability, property, and other risks.
4. Technology & Marketing
POS System: $3,000-$10,000, supporting inventory management and payment integration.
Initial Marketing: $5,000-$50,000, used for launch promotions and brand building.
III. Key Factors Affecting Costs
Geographical Location: High-traffic areas have high rent but stable customer flow, while remote areas have lower costs but require stronger marketing efforts.
Business Model:
Organic/Boutique Store: Higher inventory costs (premium goods make up 40%-60%).
Community Co-op Model: Membership-based cost-sharing reduces initial investment.
Supply Chain Management: Partnering with local suppliers can lower transportation costs but requires a balance between price and quality.
IV. Cost-Saving Strategies
Leasing Instead of Buying: Renting equipment and space reduces cash flow pressure.
Purchasing Second-Hand Equipment: Shelves, refrigerators, and other items can be acquired through auctions or liquidation sales.
Phased Opening: Start with core products and expand categories based on demand.
Digital Marketing: Use social media and local partnerships instead of traditional advertising, saving $5,000-$15,000.
Government Grants & Loans: Some regions offer small business subsidies or low-interest loans (e.g., SBA loans).
V. Profit Expectations & Payback Period
Gross Profit Margin: Traditional grocery stores range from 3%-8%, while boutique stores can reach 10%-15%.
Payback Period: Typically 2-5 years, depending on customer traffic and operational efficiency.
Example: A medium-sized supermarket serving 150 customers daily could generate approximately $2.7 million in annual revenue. With an 8% net profit margin, the annual profit would be around $220,000.
Summary & Insights
Industry Trends: Despite the rise of online shopping, physical stores still attract customers through convenience and experience (e.g., in-store dining areas).
Key Success Factors: Location selection, inventory management, and differentiation (e.g., organic food or community services).
Risk Considerations: High operating costs (labor accounting for 50%) and low profit margins require economies of scale for sustainable success.
For more detailed cost templates or breakdown calculators, refer to financial models available online (such as a 5-year forecast template from webpage 10) or use markup calculators (from webpage 1) to optimize pricing strategies.
I. Initial Investment Comparison
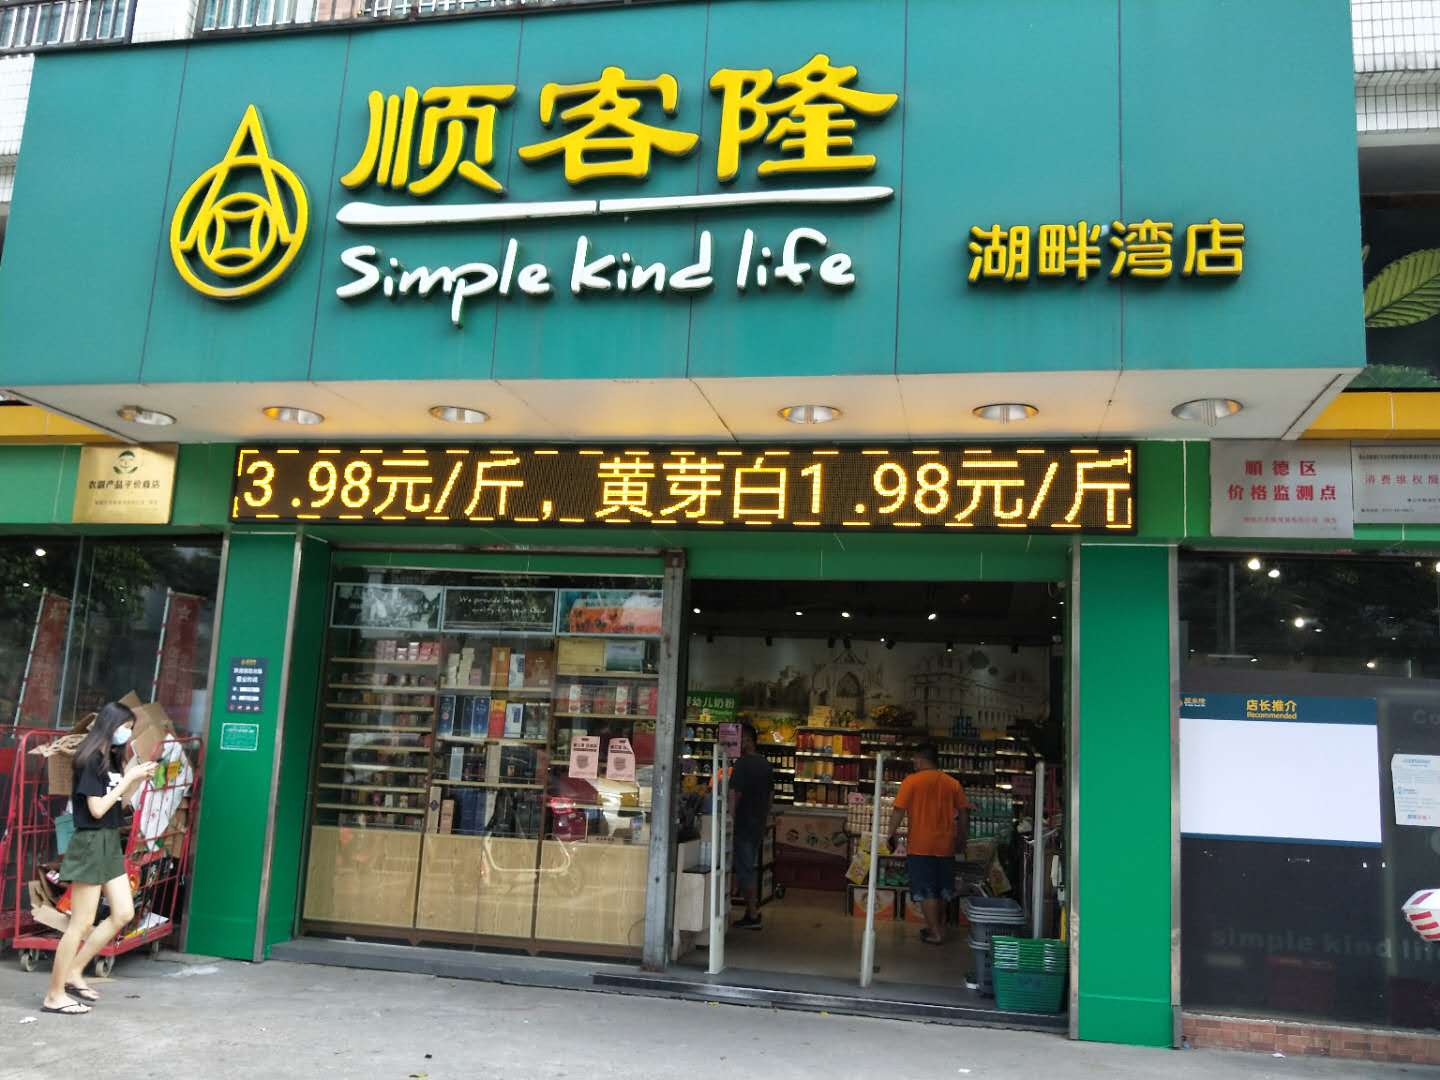
Traditional Paper Price Tags
Initial Cost: Around $1,000–$5,000 (including printers, paper, ink, and manual installation).
Features: Low initial investment but requires continuous purchases of consumables and labor costs for replacements.
Electronic Shelf Labels (ESL)
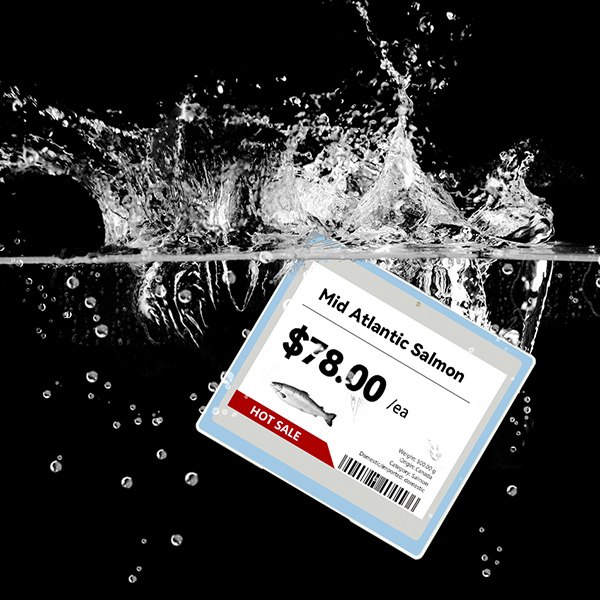
Electronic Shelf Labels unit price: Around $5–$10 each (based on mainstream brands like Hanshow and AIEinkSmart). A store with 10,000 labels would require $50,000–$100,000.
Base stations and system setup: $10,000–$20,000 (including gateways, cloud platform, and installation).
Hardware Costs:
Total Investment: $60,000–$120,000 (one-time expense).
Features: High upfront cost but no recurring consumable expenses, and some systems offer free cloud platform services.
II. Operational Cost Comparison
Traditional Paper Price Tags
Labor Costs: Requires 3–4 employees monthly to change price tags. Assuming $5,000 per employee per month, the annual labor cost is $180,000–$240,000.
Consumables Costs: Paper, ink, printer maintenance, etc., totaling $5,000–$10,000 per year.
Total Annual Operating Cost: $185,000–$250,000.
Electronic Shelf Labels (ESL)
Labor Cost Savings: Eliminates the need for 3–4 employees, reducing annual labor costs by $180,000–$240,000.
Maintenance Costs: Battery replacements (every five years), system upgrades, etc., costing around $1,000–$2,000 annually.
Total Annual Operating Cost: $1,000–$2,000.
III. Total Cost Comparison Over 5 Years
| Category | Traditional Paper Price Tags | Electronic Shelf Labels (ESL) |
|---|---|---|
| Initial Investment | $1,000–$5,000 | $60,000–$120,000 |
| 5-Year Operating Cost | $925,000–$1,250,000 | $5,000–$10,000 |
| Total 5-Year Cost | $926,000–$1,255,000 | $65,000–$130,000 |
IV. Profitability & ROI Analysis
Cost Savings:
Switching to Electronic Shelf Labels can reduce total costs by $861,000–$1,125,000 over five years compared to paper price tags.
Annual savings: $172,000–$225,000 (including labor and consumables).
Payback Period:
Initial Investment in Electronic Shelf Labels: $60,000–$120,000.
Annual Net Savings: $180,000 (labor) + $5,000 (consumables) = $185,000.
Break-even time: 4–8 months (Investment ÷ Annual Savings).
Long-Term Benefits:
Error Reduction: Electronic Shelf Labels error rate is below 0.1%, whereas paper price tags have a 5%–10% error rate, reducing customer disputes and revenue loss.
Flexible Promotions: Dynamic pricing improves sales (e.g., markdowns on perishable goods).
Sustainability & Brand Image: Reduces paper waste, aligning with eco-friendly business trends.
V. Key Takeaways
Cost Comparison: Electronic Shelf Labels has a higher initial cost but significantly lower long-term operating costs (saving over $800,000 in five years).
ROI: Typically recoups the initial investment within six months, with subsequent savings translating directly into profit.
Suitability:
ESL Recommended: For stores with high SKU counts, frequent price changes (e.g., fresh food supermarkets), or high labor costs.
Paper Tags Still Viable: Only for stores with very few SKUs (e.g., small convenience stores) and stable pricing.
VI. Additional Recommendations
Pilot Deployment: Start with Electronic Shelf Labels for frequently updated products (e.g., promotional items) and gradually expand.
Choosing a Vendor: Opt for brands offering full-service solutions (e.g., AIEinkSmart, Hanshow) to simplify maintenance.
Government Support: Check for smart retail subsidies or low-interest loans to further reduce initial costs.
Based on this analysis, electronic shelf labels provide significant long-term financial benefits, making them ideal for medium to large retail stores looking to accelerate digital transformation.
Electronic Shelf Labels

